I had to write a short paper for my propulsion class, so I put together a quick and dirty performance analysis of a garden-variety RV-8. I used the open source Jupyter Notebook and the Python programming language to run the numbers. The primary goal was to quickly generate some pretty graphs for the report.
Required Software
- Anaconda Python, includes NumPy, SciPy, Matplotlib, Seaborn, etc.
- Jupyter Notebook, to display and edit this document, included with Anaconda.
- Seaborn, for plotting aesthetics.
- Ambiance, for standard atmosphere reference.
Because Ambiance is not included by default with the Anaconda Python distribution, we’ll attempt to install it into the current running Jupyter kernel, directly from this notebook. Ambiance is currently available via pip install but not conda install.
# Install a pip package in the current Jupyter kernel
import sys
!{sys.executable} -m pip install --upgrade pip
!{sys.executable} -m pip install ambiance
import numpy as np
import seaborn as sns
import matplotlib.pyplot as plt
from ambiance import Atmosphere
# Seaborne settings
sns.set_context("paper", font_scale=1.2,
    rc={"lines.linewidth": 3})
sns.set_style("darkgrid")
%matplotlib inline
# Suppress numpy divide-by-zero warnings
np.seterr(divide='ignore')
Van’s Aircraft RV-8 Specifications
# Wing span (ft)
b = 24
# Wing area (sq ft)
S = 116
# Wing chord (constant, no taper)
c = S/b
# Aspect ratio
AR = b**2/S
# Gross weight (lbs)
W = 1800
# Wing loading (lb/sq ft)
WL = W/S
# Fuel capacity (US gal)
fuel_capacity = 42
Zero-Lift Drag and Oswald Efficiency
Initially, we cheat a bit here, using data derived by Kevin Horton in his AeroCalc Python package.
# Oswald efficiency factor estimation (ref: D. Raymer [2], Eqn. (12.49), p. 347.)
e = 1.78 * (1 - 0.045 * AR**0.68) - 0.64
# Oswald efficiency factor estimation (ref.: K. Horton)
e = 0.86
# Parasite drag coefficient, zero-lift (ref.: K. Horton)
C_d_0 = 0.0209
Free Stream Velocity
A range of likely velocity values for a light aircraft, from about 60 to 220 KTAS (knots true airspeed).
# Free stream velocity (ft/s)
V = np.arange(100,370)
U.S. Standard Atmosphere
The Python Ambiance package provides a full implementation of the 1993 ICAO standard atmosphere. Ambiance allows the creation an Atmosphere object from which atmospheric properties can be easily derived in a human-readable form.
Compare computed results here with an online Standard Atmosphere Calculator.
# ICAO 1993 Standard Atmosphere (SI units!)
# Altitude to test (ft)
altitude = 23000
# Atmosphere() needs SI units
alt_SI = altitude * 0.3048
# Create an Atmosphere object
atm = Atmosphere(alt_SI)
# Air density (kg/m^3)
# (returns a np.array)
rho = atm.density
# Air density (slugs/ft^3)
rho = rho[0] * 0.00194032

# Compare computed results with: https://www.digitaldutch.com/atmoscalc/
print("Air density at {:,.0f} ft = {:,.6f} slugs/ft^3 (1973 Standard Atmosphere)"
      .format(23000, 0.00114260))
print("Air density at {:,.0f} ft = {:,.6f} slugs/ft^3 (Python ambiance.Atmosphere)"
      .format(altitude, rho))
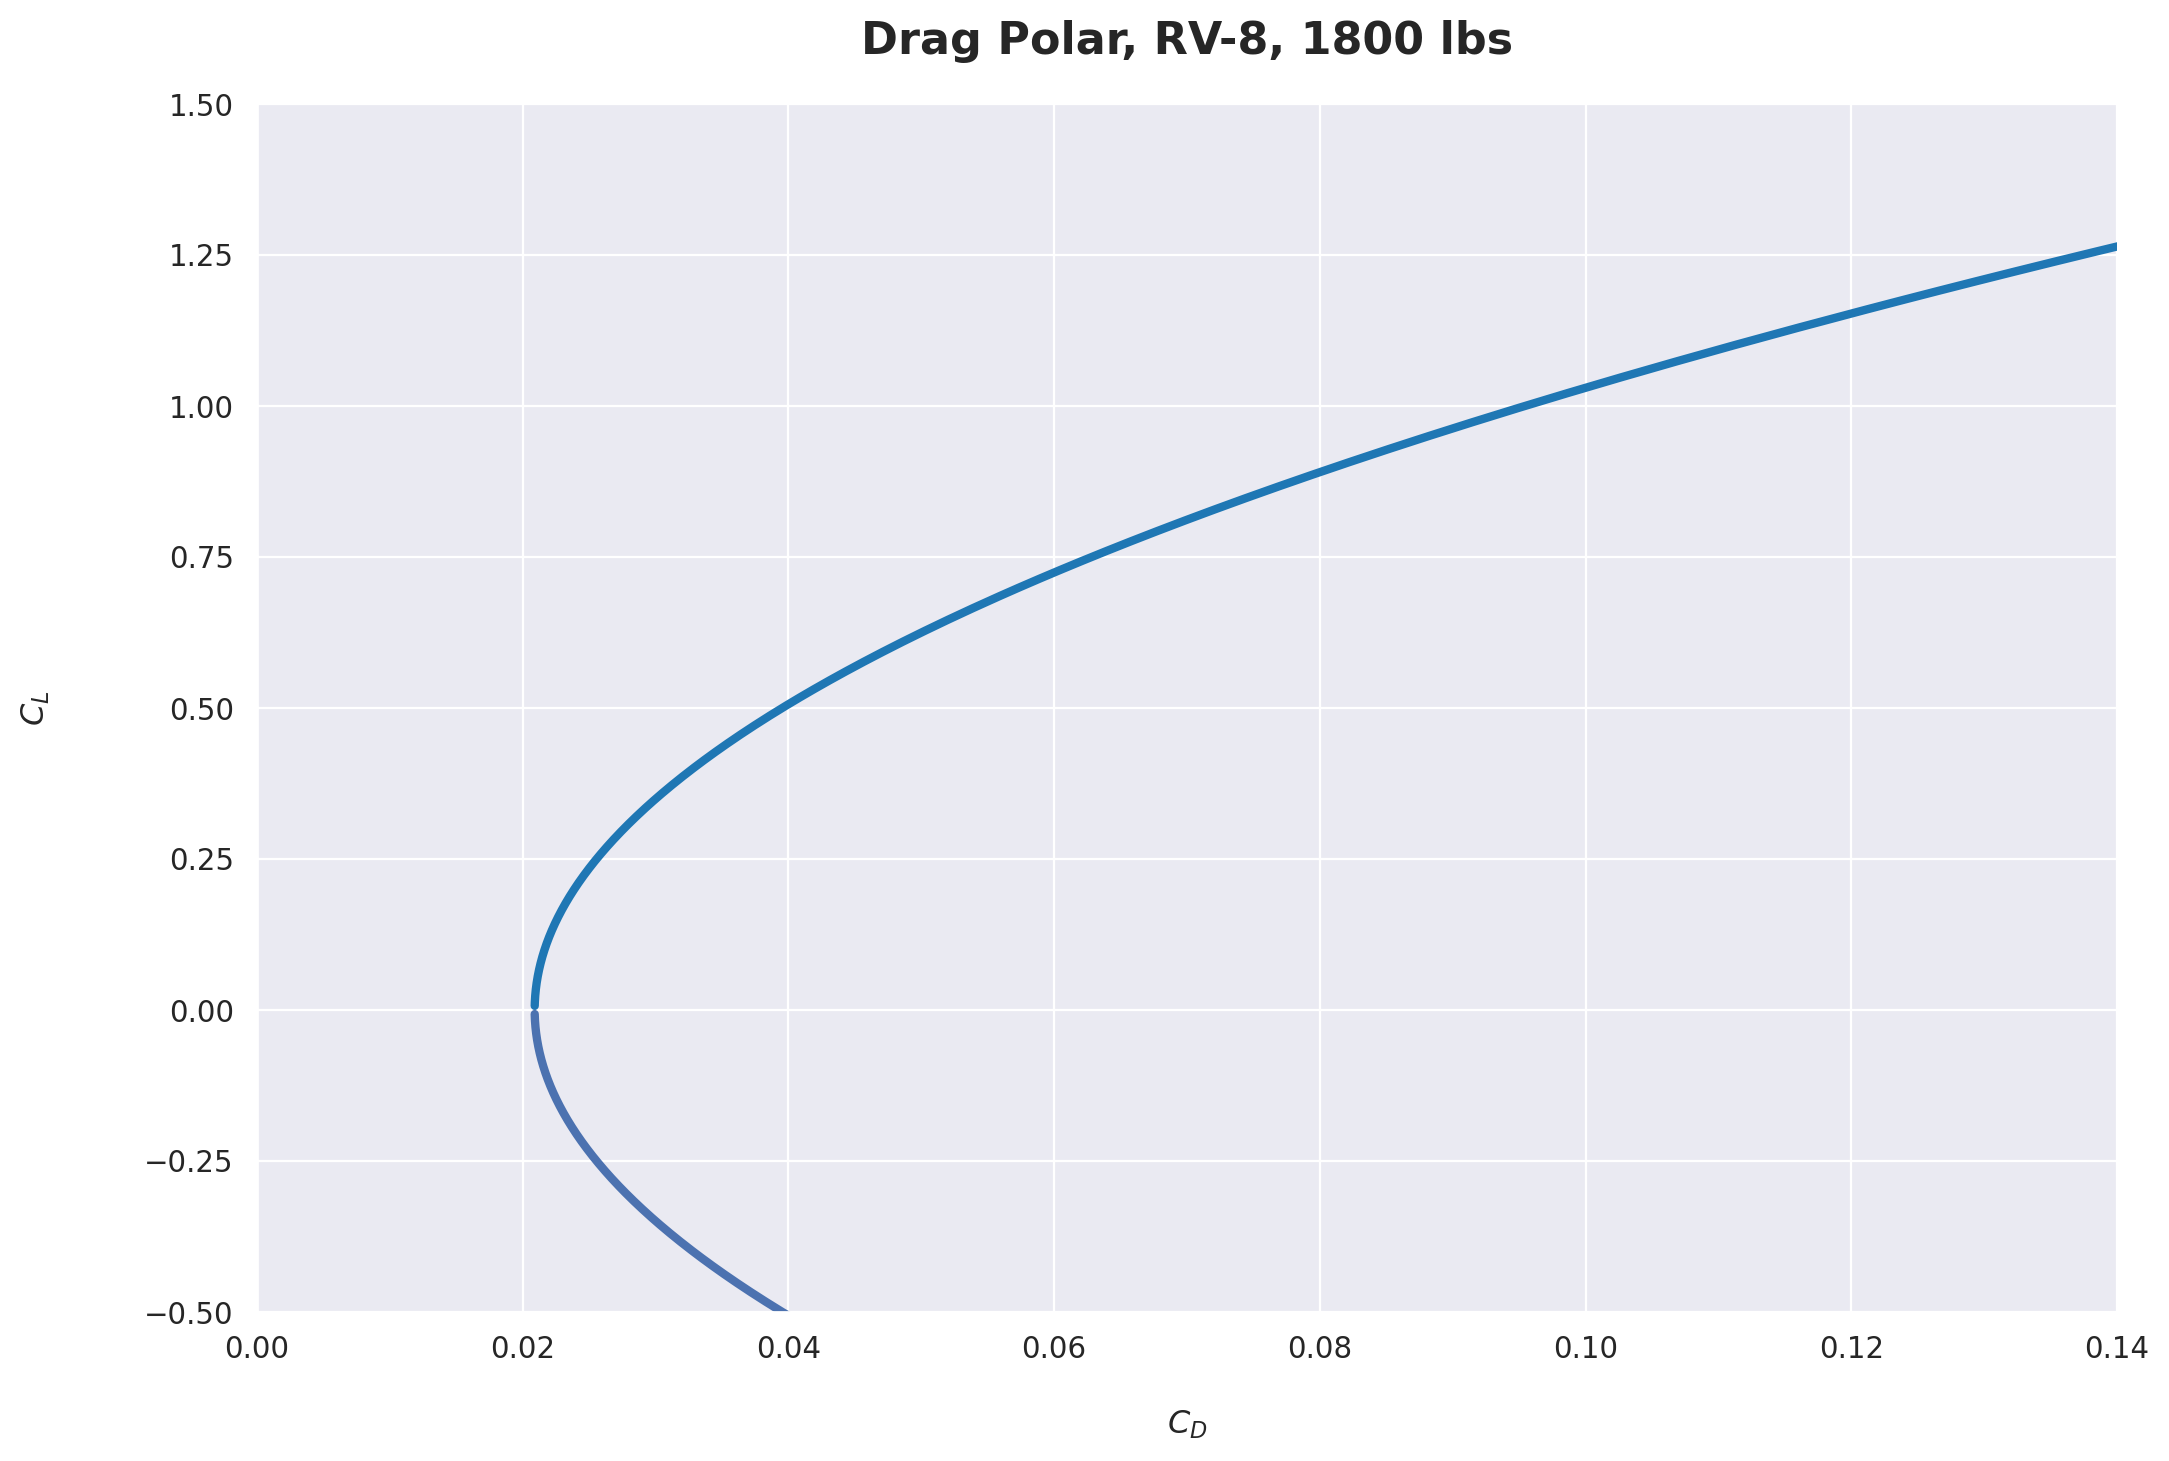
The Drag Polar
Equations from Anderson [3].
\begin{equation} \tag{6.17} C_L = \frac{W}{\frac{1}{2} \rho_{\infty} V_{\infty}^2 S} \end{equation}
\begin{equation} \tag{6.1c} C_D = C_{D,0} + \frac{C_L^2}{\pi e AR} \end{equation}
def plot_drag_polar():
    """
    Plot drag polar for altitudes from sea level to Max_Alt in 4,000-ft increments.
    """
    # This range allows the +/- curves to meet in the middle
    V = np.arange(0,2000)

    # Atmosphere() needs SI units
    alt_SI = altitude * 0.3048

    # Create an Atmosphere object
    atm = Atmosphere(alt_SI)

    # Air density (kg/m^3)
    # (returns a np.array)
    rho = atm.density

    # Air density (slugs/ft^3)
    rho = rho[0] * 0.00194032

    # Lift coefficient
    CL = W / (0.5 * rho * V**2 * S)

    # Drag coefficient
    CD = C_d_0 + CL**2 / (np.pi * e * AR)

    # Add a figure
    fig = plt.figure(figsize=(12,8))
    plt.plot(CD,CL)
    plt.plot(CD,-CL,color="#4c72b0")

    # Locate the axis labels and limits
    ax = plt.gca()
    ax.set_xlim([0,0.14])
    ax.set_ylim([-0.5,1.5])
    ax.xaxis.set_label_coords(0.5, -0.08)
    ax.yaxis.set_label_coords(-0.11, 0.5)

    # Add title and axis labels
    plt.title("Drag Polar, RV-8, 1800 lbs", fontsize=16, pad=18, fontweight='bold')
    plt.ylabel(r'$C_L$', labelpad=18)
    plt.xlabel(r'$C_D$', labelpad=18)
    sns.despine()
    plt.show()

    # Save the figure as PNG
    fig.savefig("charts/drag-polar.png", dpi=200)

plot_drag_polar()
Thrust Required for Level Flight
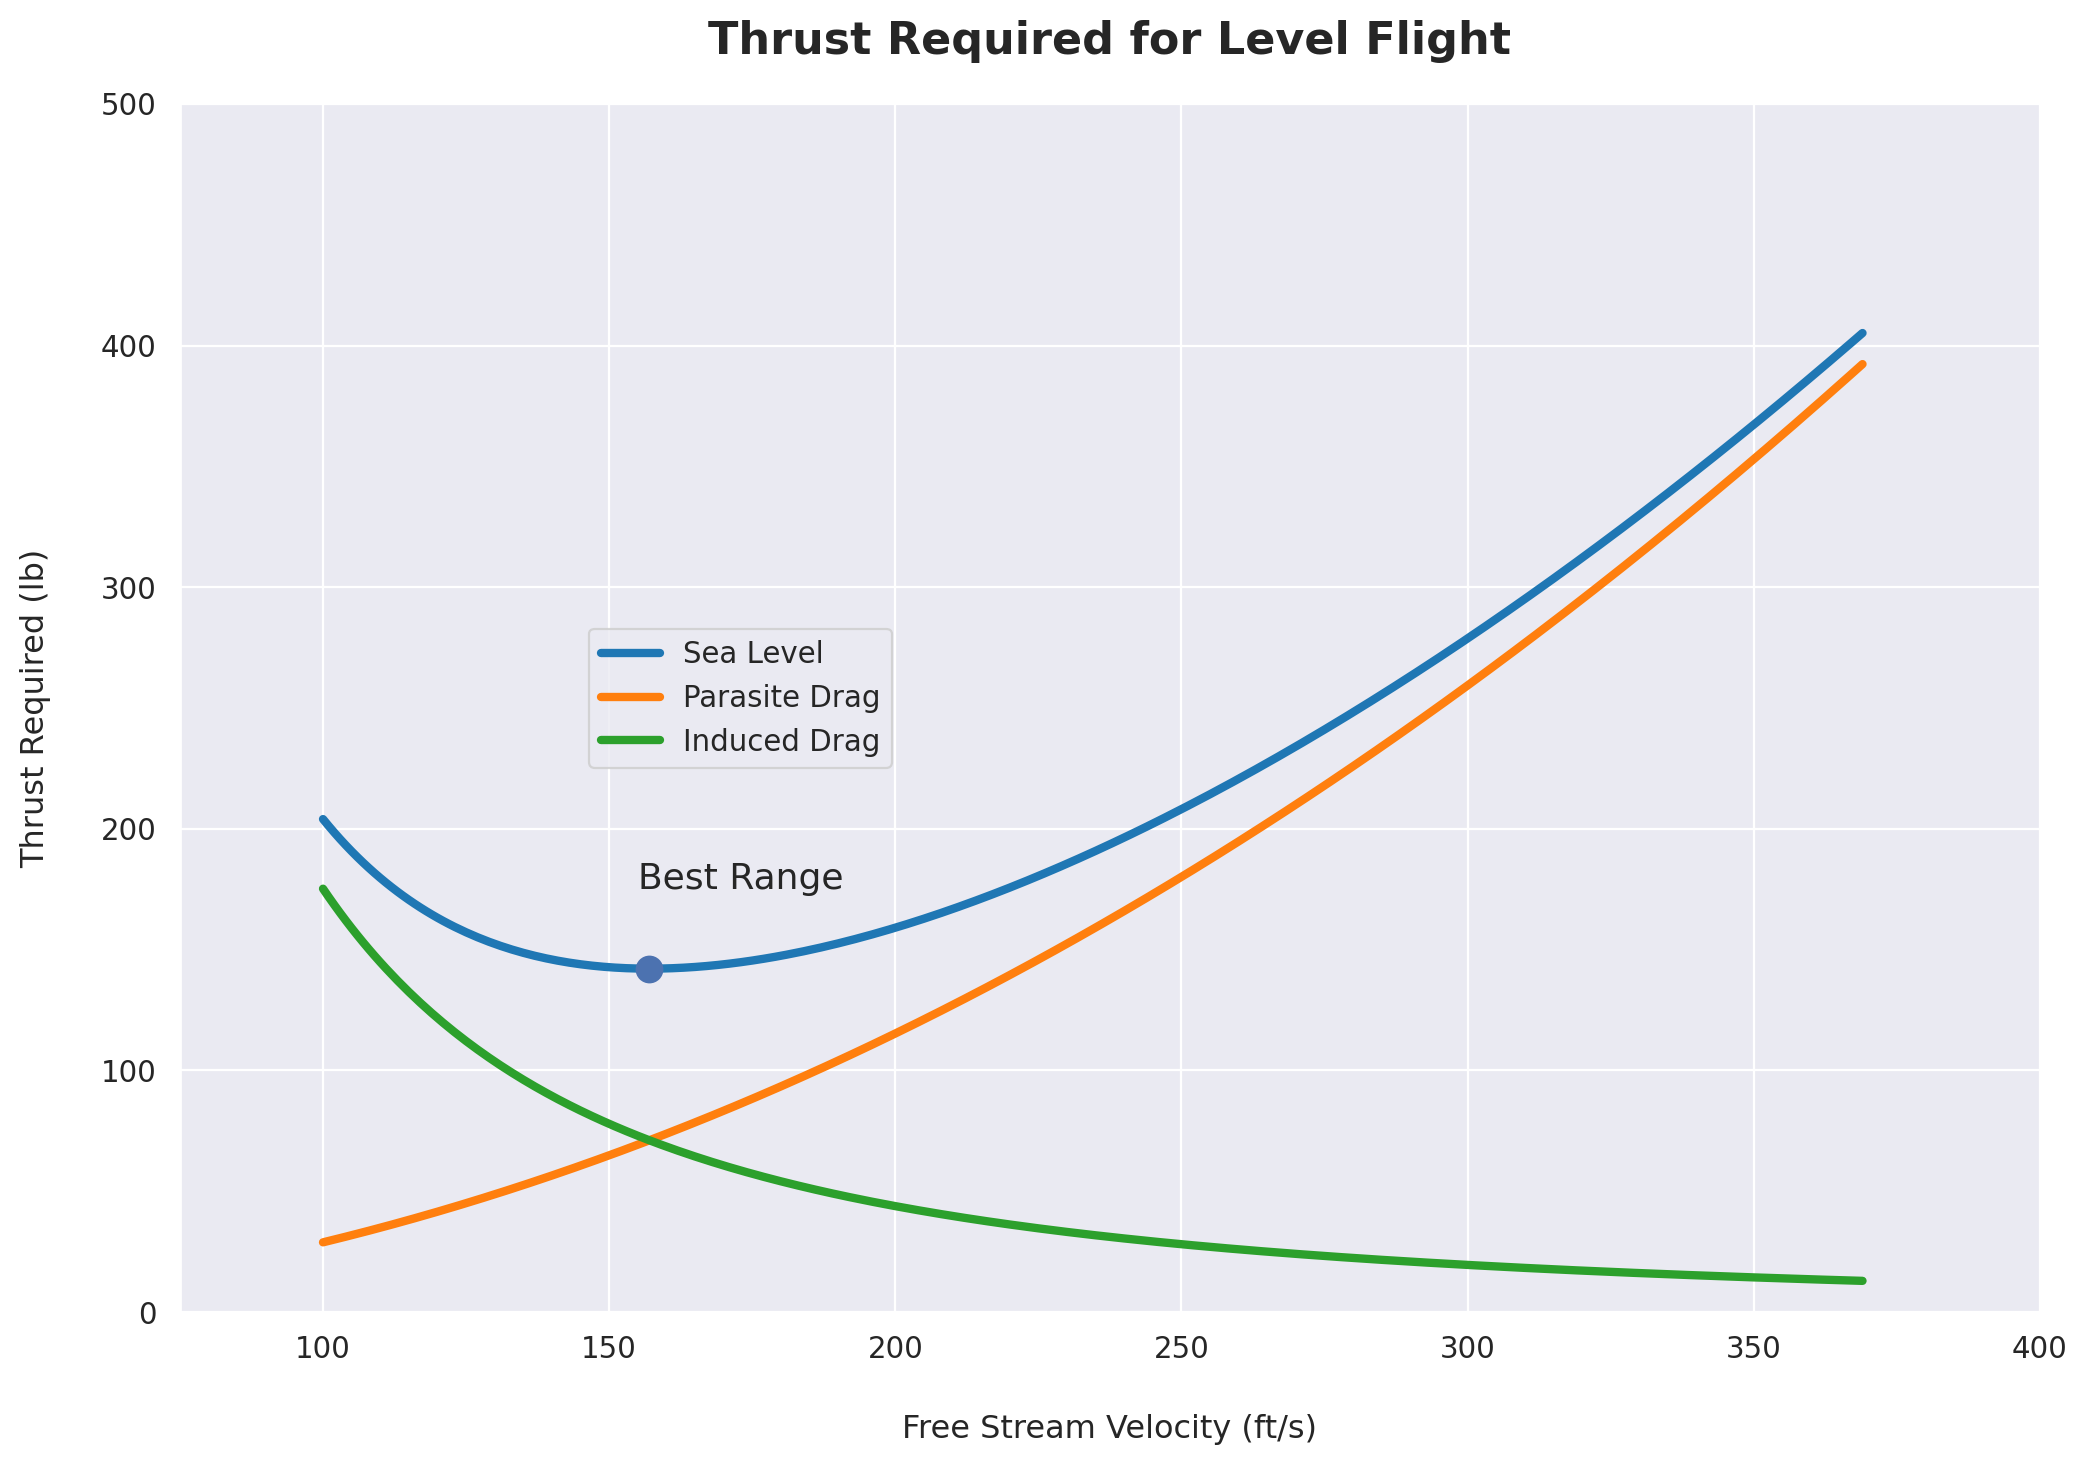
Equations from Anderson [3].
\begin{equation} \tag{6.13} T = D = q_{\infty} S C_D \end{equation}
\begin{equation} \tag{6.14} L = W = q_{\infty} S C_D \end{equation}
\begin{equation} \tag{6.15} \frac{T}{W} = \frac{C_D}{C_L} \end{equation}
\begin{equation} \tag{6.16} T_R = \frac{W}{C_L/C_D} \end{equation}
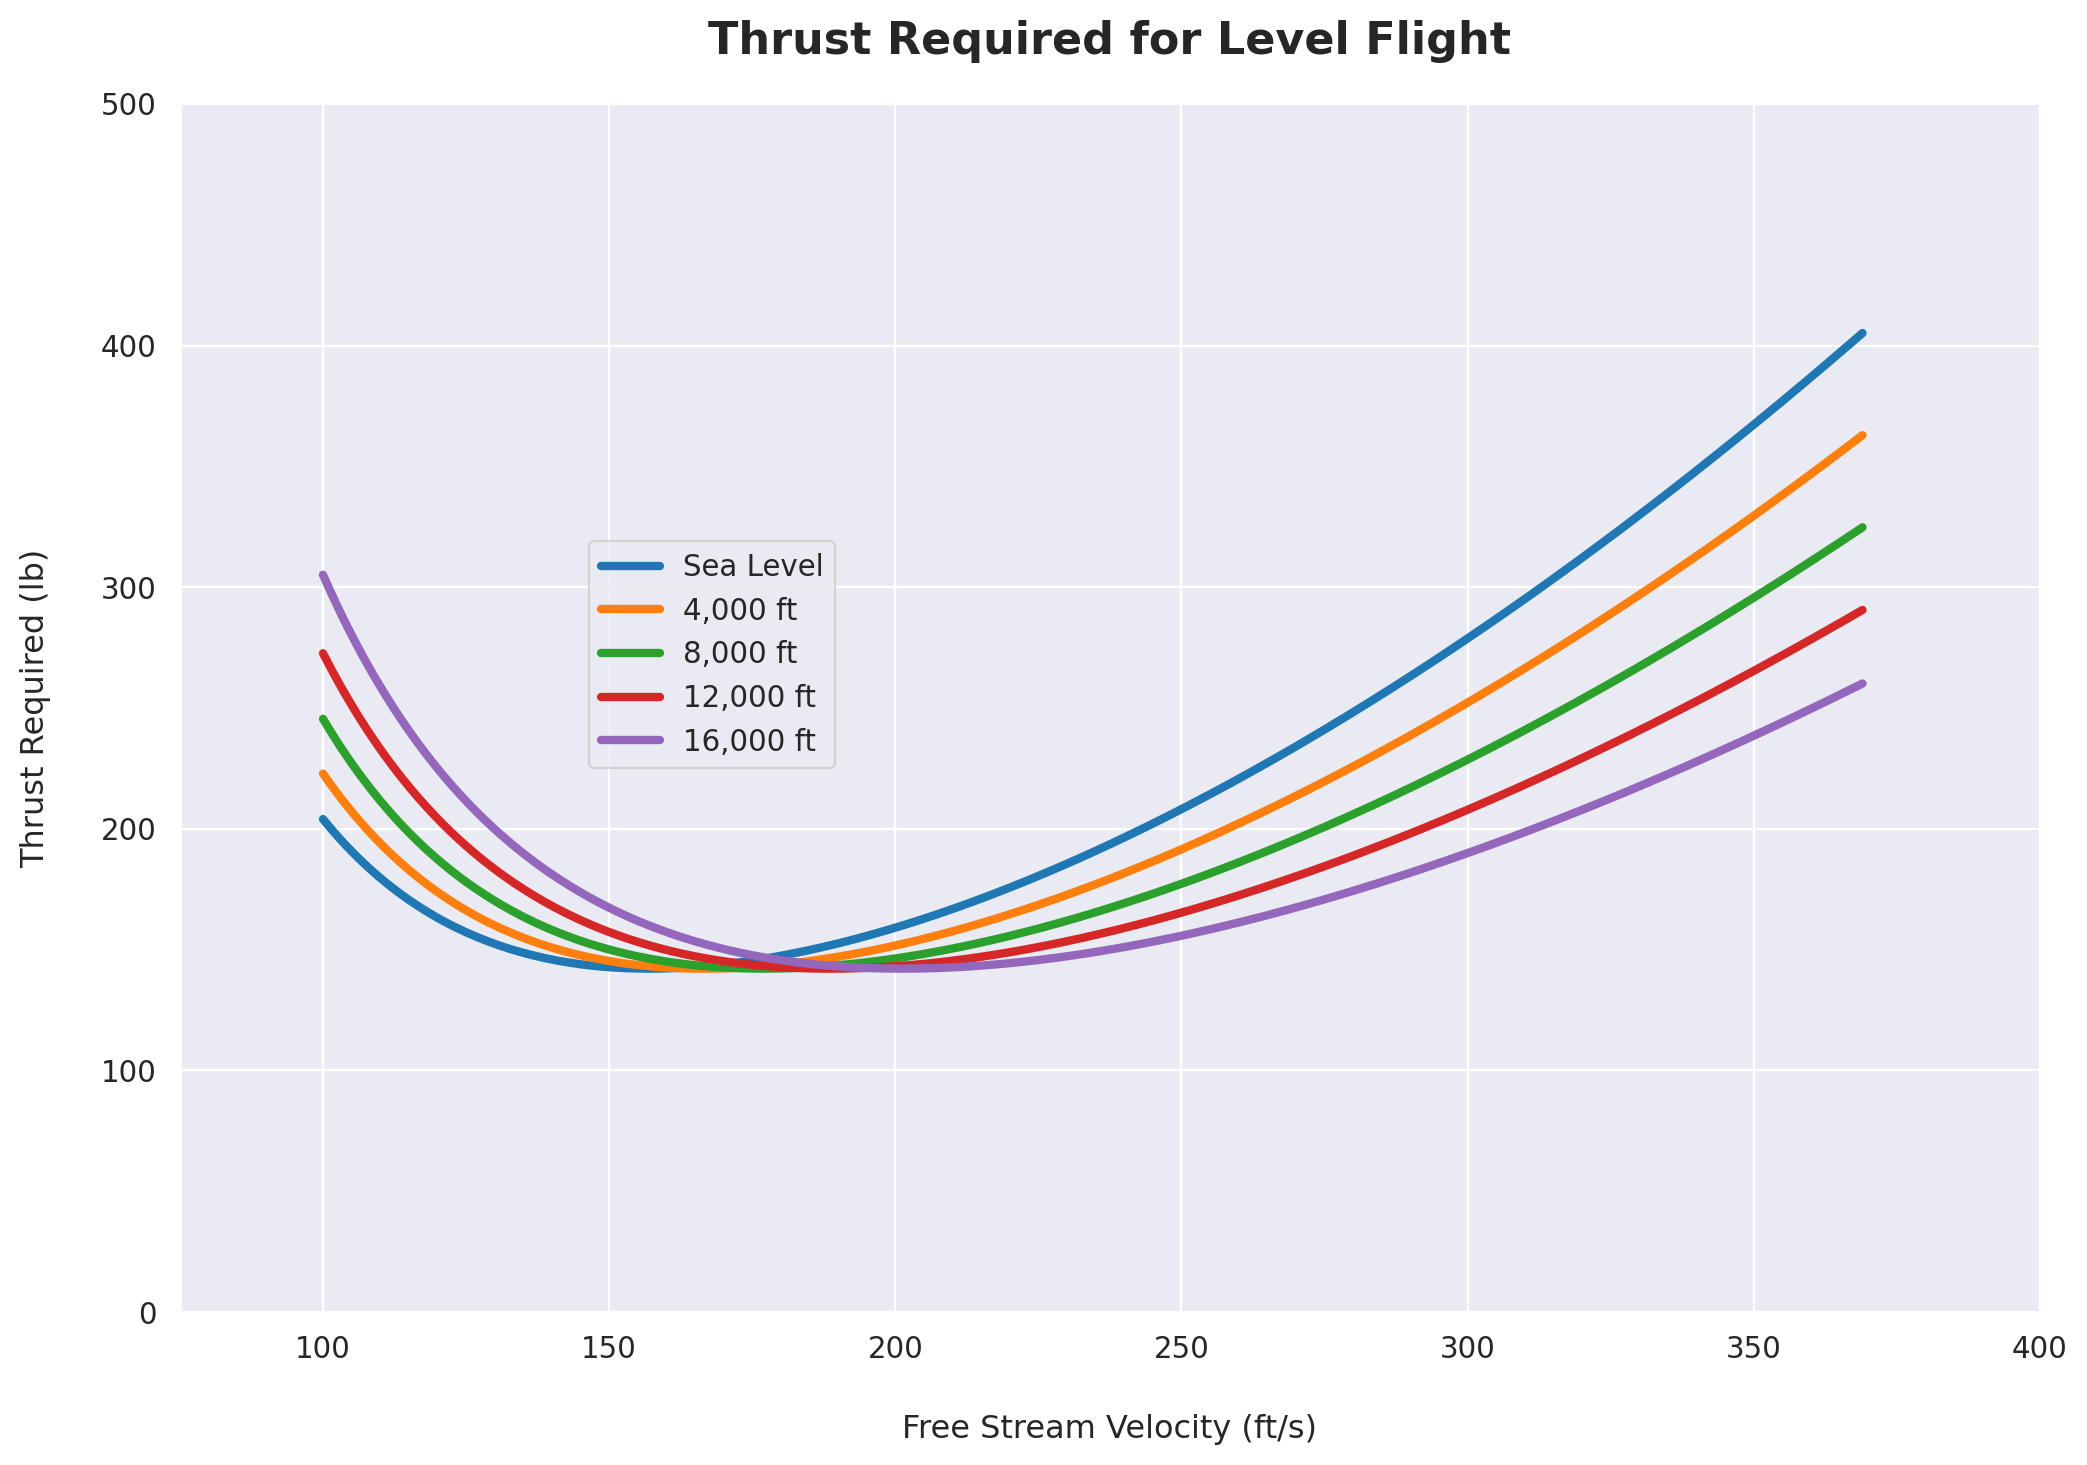
def plot_thrust_required(V, Max_Alt=0, min_color="#4c72b0", drag_curves=False, best_range=False):
    """
    Plot thrust required curves for altitudes from sea level to Max_Alt in 4,000-ft increments.

    Keyword arguments:
    V -- a 1D array of velocity values in ft/s
    Max_Alt -- an altitude, in feet, at which to stop plotting curves (default 0, sea level)
    min_color -- a hex color code for the min value marker
    drag_curves -- include drag curves? 'Y' or 'N'
    """
    fig = plt.figure(figsize=(12,8))
    legend = ['Sea Level']
    for altitude in range(0, Max_Alt + 1, 4000):

        # Atmosphere() needs SI units
        alt_SI = altitude * 0.3048

        # Create an Atmosphere object
        atm = Atmosphere(alt_SI)

        # Air density (kg/m^3)
        # (returns a np.array)
        rho = atm.density

        # Air density (slugs/ft^3)
        rho = rho[0] * 0.00194032

        # Lift coefficient
        CL = W / (0.5 * rho * V**2 * S)

        # Drag coefficient
        CD = C_d_0 + CL**2 / (np.pi * e * AR)

        # Lift force
        L = CL * 0.5 * rho * V**2 * S

        # Parasite drag
        Dp = 0.5 * C_d_0 * rho * V**2 * S

        # Induced drag
        Di = (2 * L**2) / (rho * V**2 * S * np.pi * e * AR)

        # Thrust required (lbs)
        Tr = W / (CL / CD)

        # Add a curve
        plt.plot(V,Tr)

        # Plot drag curves
        if drag_curves == True:
            plt.plot(V,Dp)
            plt.plot(V,Di)
            legend.append("Parasite Drag")
            legend.append("Induced Drag")

        # Update the legend
        if altitude > 0:
            legend.append("{:,.0f} ft".format(altitude))

    # Locate the axis labels and limits
    ax = plt.gca()
    ax.set_xlim([75,400])
    ax.set_ylim([0,500])

    if best_range == True:
        ax.text(155, 175, 'Best Range', size=13)

    # Add title and axis labels
    plt.legend(legend,loc=(0.22, 0.45))
    plt.title("Thrust Required for Level Flight", fontsize=16, pad=18, fontweight='bold')
    plt.ylabel('Thrust Required (lb)', labelpad=18)
    plt.xlabel('Free Stream Velocity (ft/s)', labelpad=18)

    # Plot (L/D)max point
    if best_range == True:
        plt.plot(V[np.argmin(Tr)], np.amin(Tr), marker='o', ms=9, color=min_color)

    # Show the figure
    sns.despine(trim=True)
    plt.show()

    # Save the figure as PNG
    fig.savefig("charts/thrust-required-{}.png".format(Max_Alt), dpi=200)

plot_thrust_required(V,0,'#4c72b0',True,True)
plot_thrust_required(V,16000,"#64b5cd")
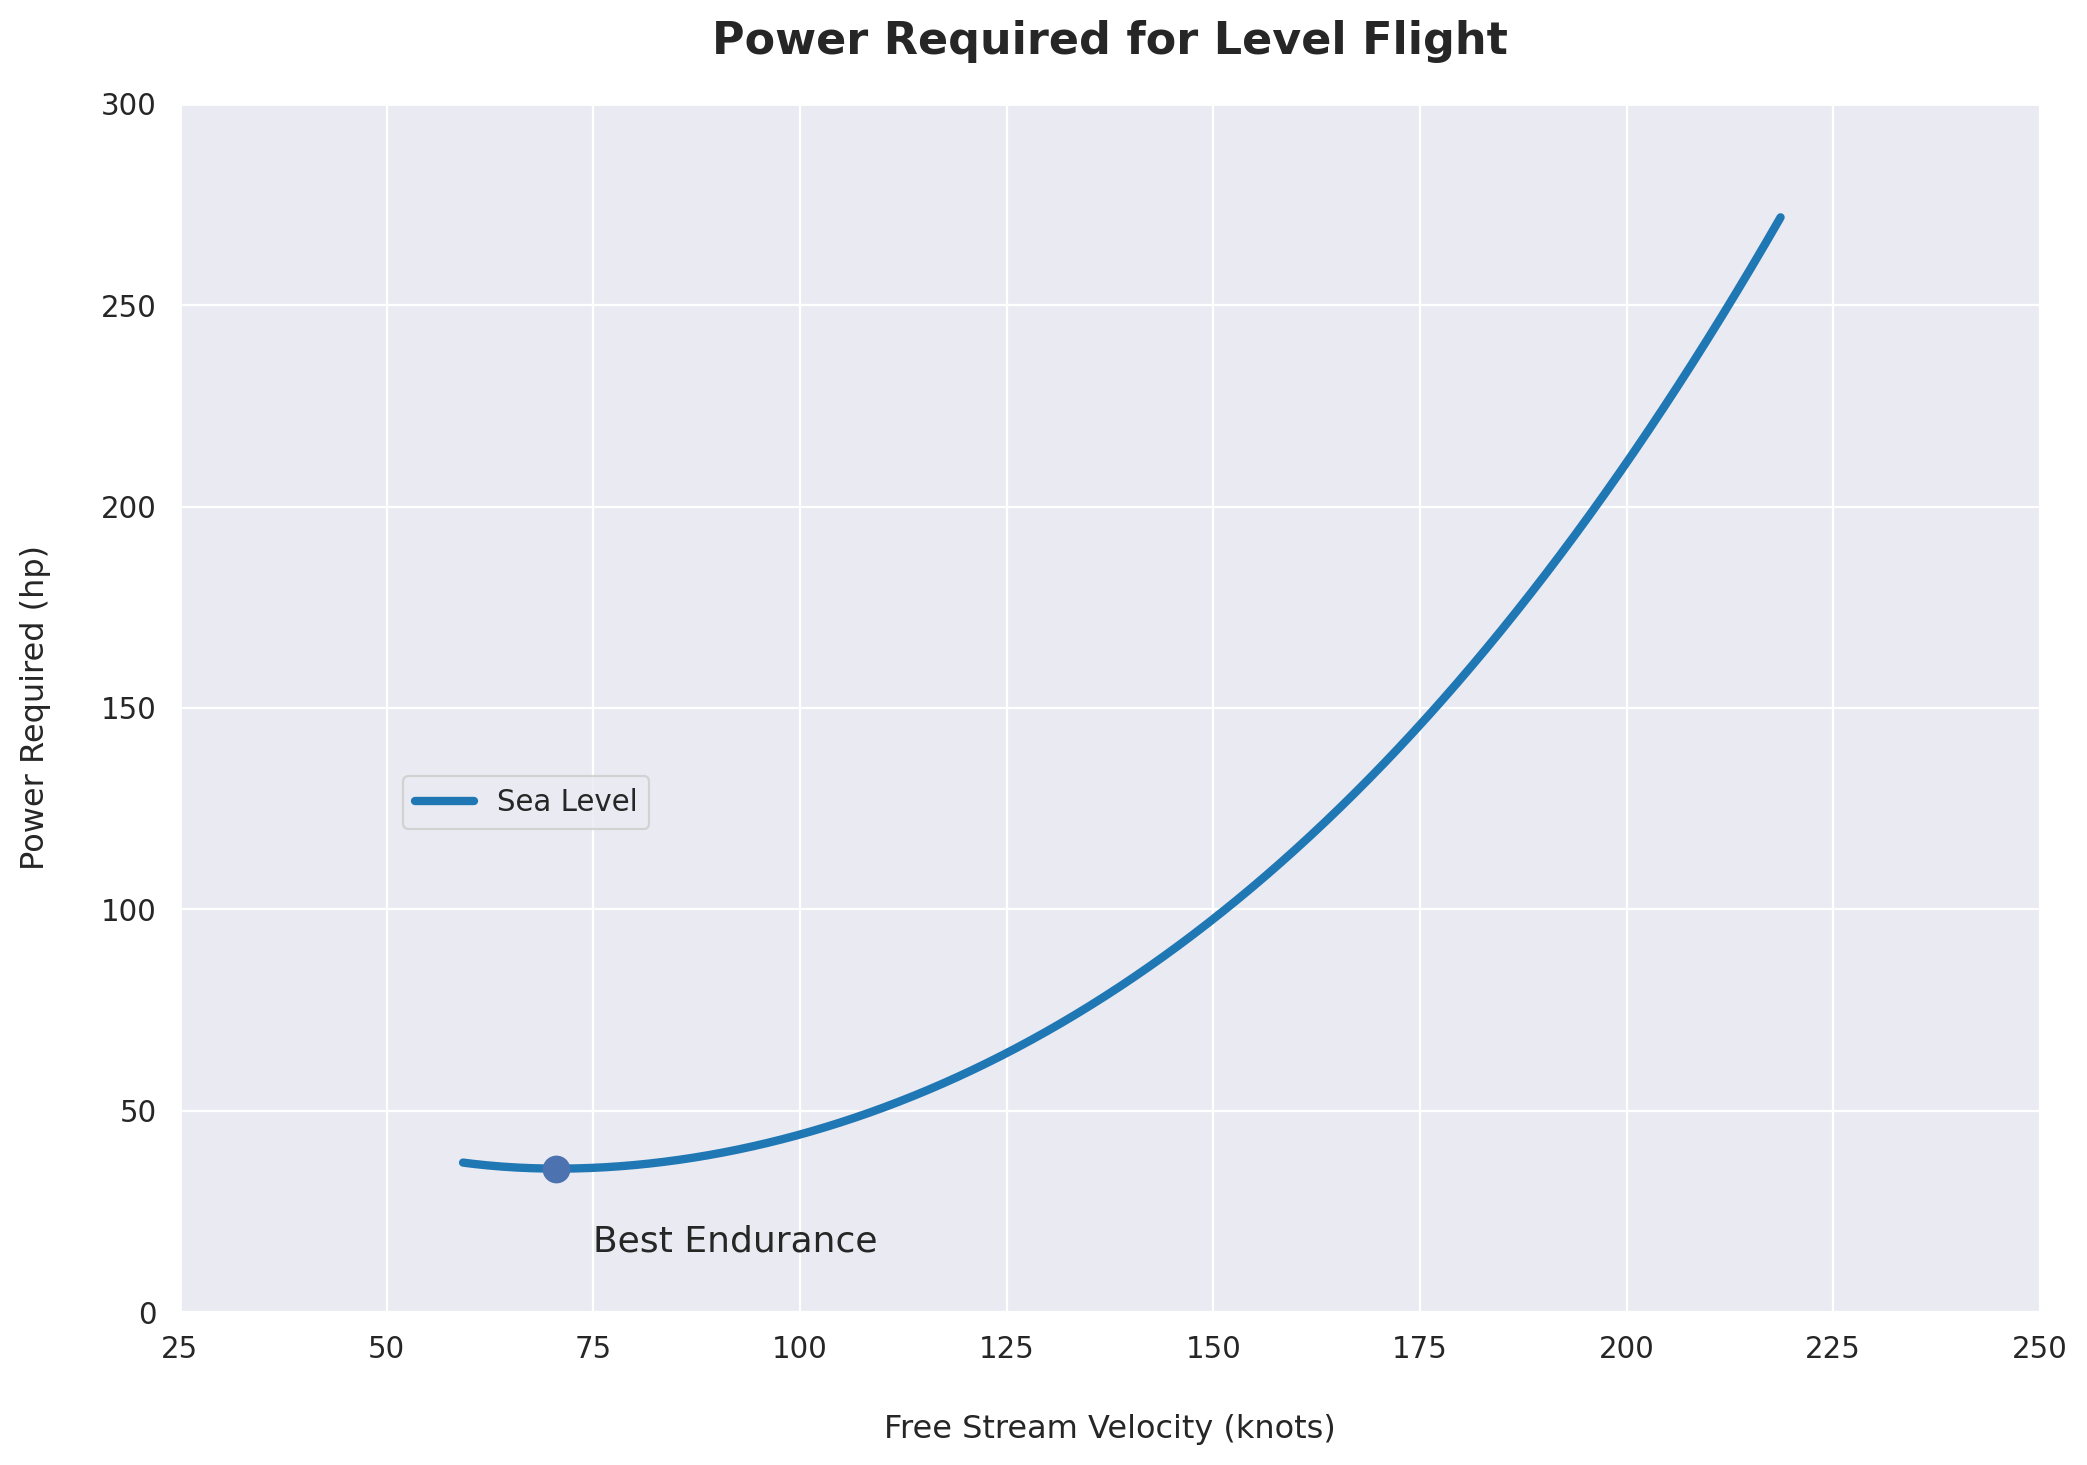
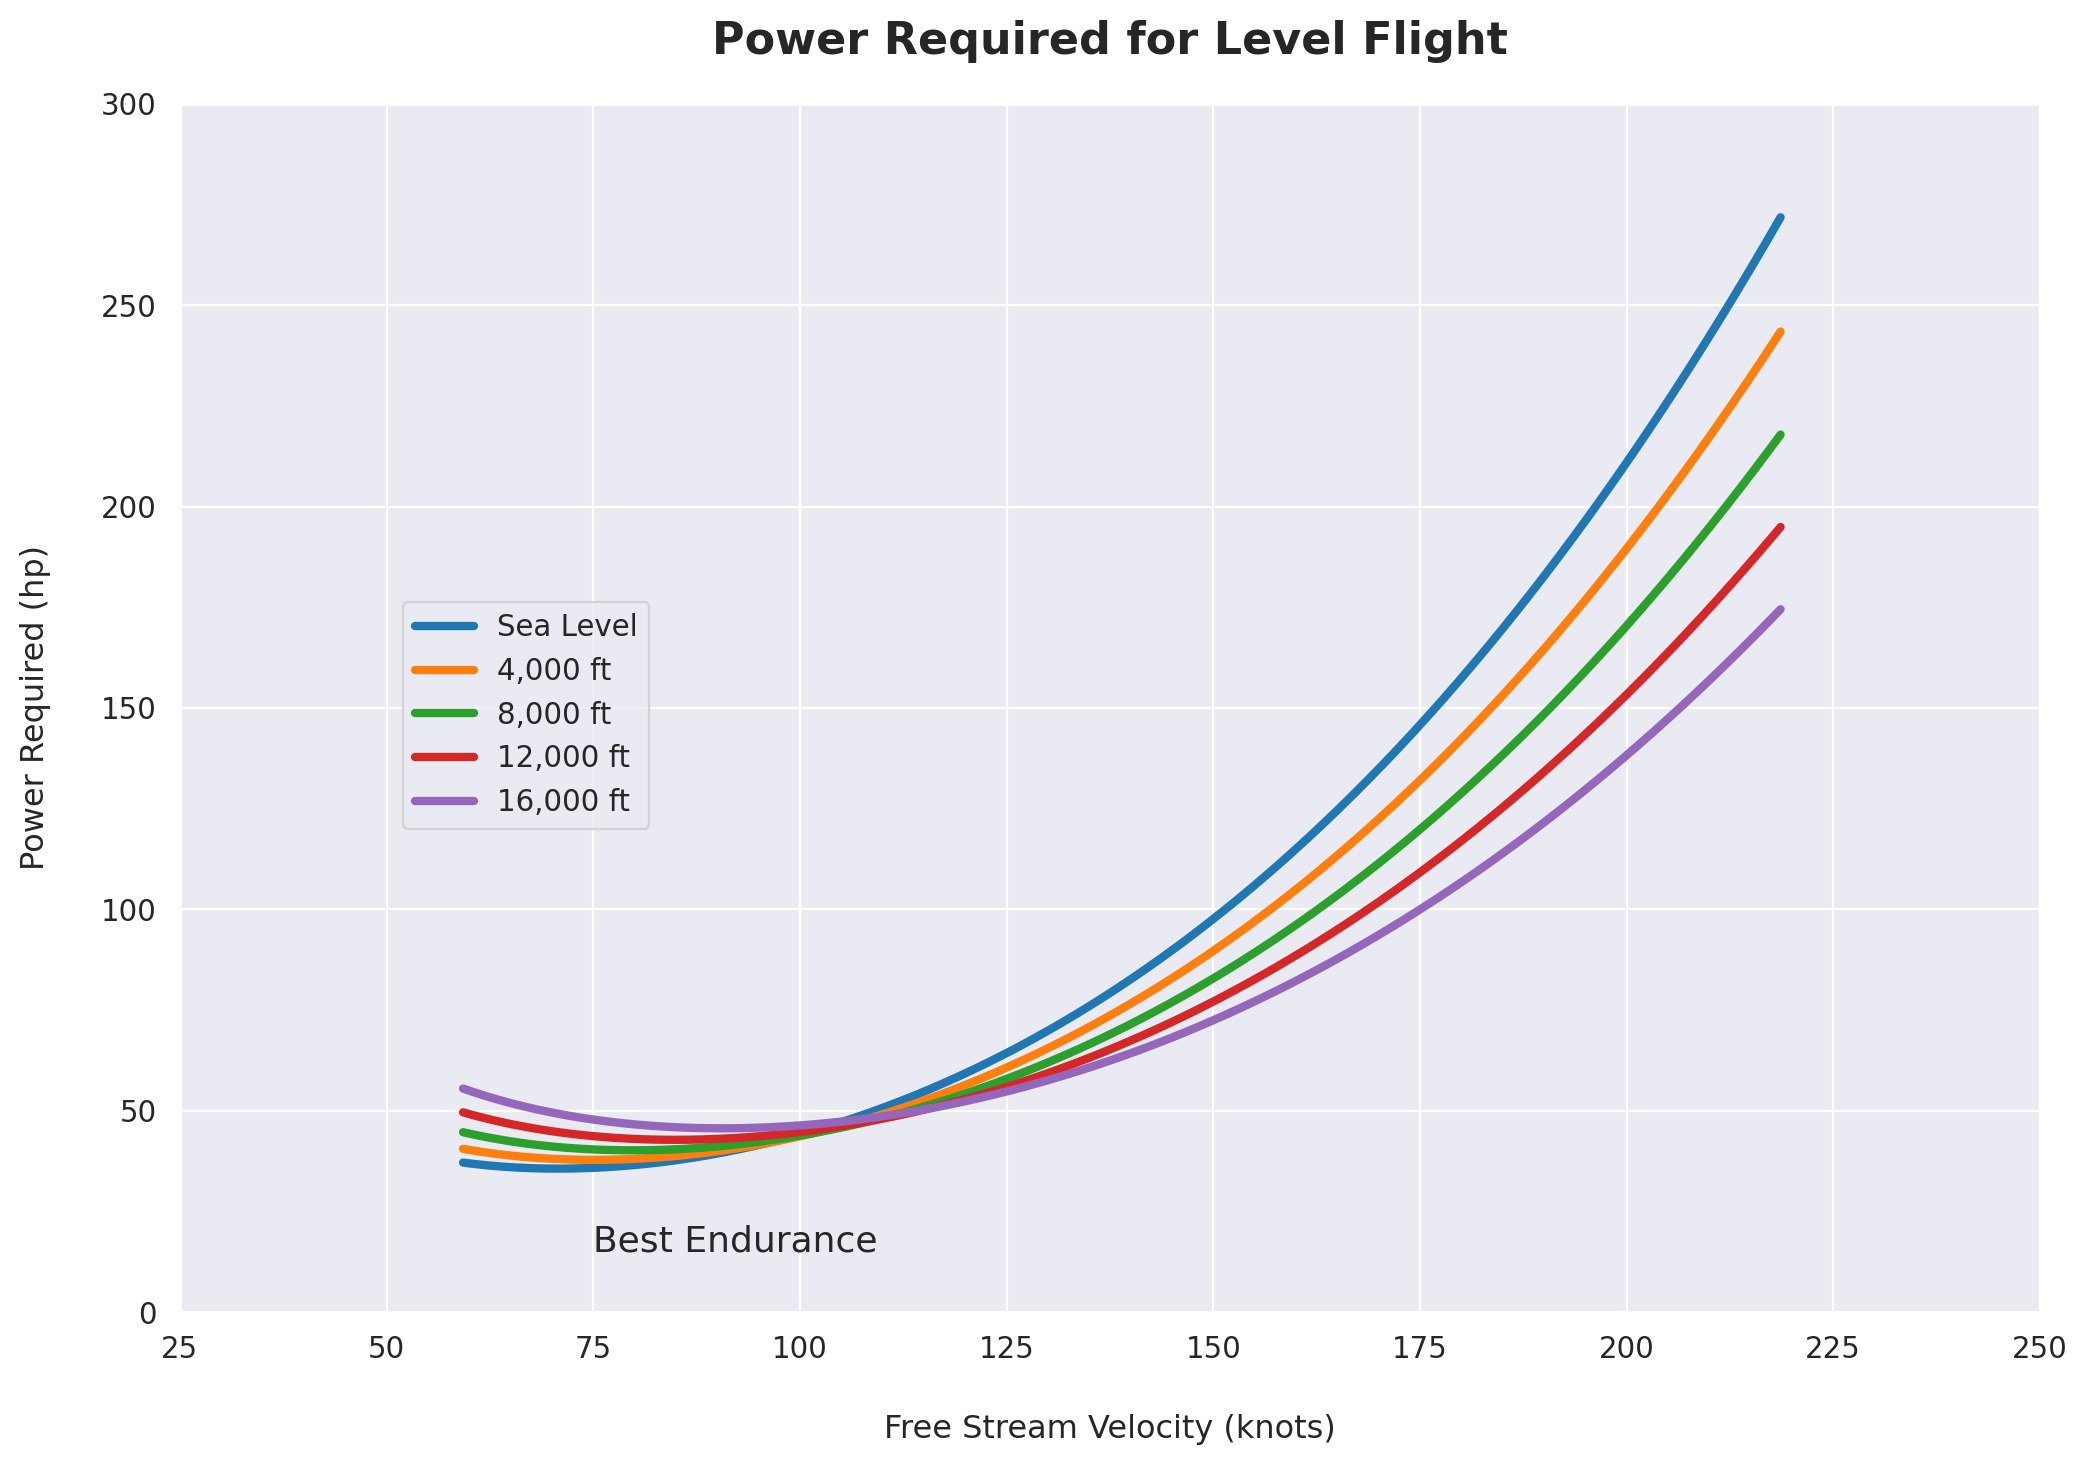
Power Required for Level Flight
def plot_power_required(V, Max_Alt=0, ld_max=False, min_color="#4c72b0"):
    """
    Plot power required curves for altitudes from sea level to Max_Alt in 4,000-ft increments.

    Keyword arguments:
    V -- a 1D array of velocity values in ft/s
    Max_Alt -- an altitude, in feet, at which to stop plotting curves (default 0, sea level)
    min_color -- a hex color code for the min value marker
    """
    fig = plt.figure(figsize=(12,8))
    legend = ['Sea Level']

    for altitude in range(0, Max_Alt + 1, 4000):

        # Atmosphere() needs SI units
        alt_SI = altitude * 0.3048

        # Create an Atmosphere object
        atm = Atmosphere(alt_SI)

        # Air density (kg/m^3)
        # (returns a np.array)
        rho = atm.density

        # Air density (slugs/ft^3)
        rho = rho[0] * 0.00194032

        # Lift coefficient
        CL = W / (0.5 * rho * V**2 * S)

        # Drag coefficient
        CD = C_d_0 + CL**2 / (np.pi * e * AR)

        # Thrust required (lbs)
        Tr = W / (CL / CD)

        # Power required (hp)
        Pr = (Tr * V) / 550

        # Add a curve (1 ft/s = 0.592484 knots)
        plt.plot(V*0.592484,Pr)

        # Update the legend
        if altitude > 0:
            legend.append("{:,.0f} ft".format(altitude))

    # Locate the axis labels and limits
    ax = plt.gca()
    ax.set_xlim([25,250])
    ax.set_ylim([0,300])
    ax.text(75, 15, 'Best Endurance', size=13)

    # Add title and axis labels
    plt.legend(legend,loc=(0.12, 0.4))
    plt.title("Power Required for Level Flight", fontsize=16, pad=18, fontweight='bold')
    plt.ylabel('Power Required (hp)', labelpad=18)
    plt.xlabel('Free Stream Velocity (knots)', labelpad=18)

    # Plot (L/D)max point
    if ld_max == True:
        plt.plot(V[np.argmin(Pr)]*0.592484, np.amin(Pr), marker='o', ms=9, color=min_color)

    # Show the plot
    plt.show()

    # Save the figure as PNG
    fig.savefig("charts/power-required-{}.png".format(Max_Alt), dpi=200)

plot_power_required(V,0,True)
plot_power_required(V,16000)
Propeller Efficiency
def prop_eta(D=82, eta_guess=0.9, P=300, V=50, altitude=0, es=0.0001):
    """
    Estimate propeller efficiency using a numerical method (ref: Solies [9]).

    Keyword arguments:
    D -- propeller diameter, inches
    eta_guess -- an initial guess of propeller efficiency, percent
    P -- engine brake horsepower available at selected altitude
    V -- a velocity or array of velocities in knots
    altitude -- operating altitude, feet
    es -- percent error at which solution converges (smaller = more iterations)
    """

    # Propulsive disk area, ft^2
    A = (np.pi * (D/12)**2) / 4

    # Atmosphere() needs SI units
    alt_SI = altitude * 0.3048

    # Create an Atmosphere object
    atm = Atmosphere(alt_SI)

    # Air density (kg/m^3)
    # (returns a np.array)
    rho = atm.density

    # Air density (slugs/ft^3)
    rho = rho[0] * 0.00194032

    # Convert V from knots to ft/s
    V = V * 1.68781

    # Convert P from hp to ft*lb/s
    P = P * 550

    # Initial error, %
    ea = 100

    # Initial guess
    eta_0 = eta_guess

    while np.any(ea) > es:

        # (2) Propeller thrust, lbs
        T = (eta_0 * P) / V

        # (3) Velocity at the propeller disk is V + dV/2
        dV_by_2 = -(V/2) + np.sqrt((V**2)/4 + T/(2 * rho * A))

        # (4) New efficiency
        eta_i = V / (V + dV_by_2)

        # (1) New eta
        eta = eta_guess * eta_i

        # Error
        ea = np.abs((eta - eta_0)/eta) * 100

        if np.any(ea) > es:
            eta_0 = eta

    return eta
# From Lycoming O-360 manual, Fig. 3-26, "Sea Level and Altitude Performance, IO-360-M1B"
io360_bhp ={0:180, 4000:160, 8000:140, 12000:120, 16000:100, 20000:90}

# Hartzell propeller diameter, inches
D = 74
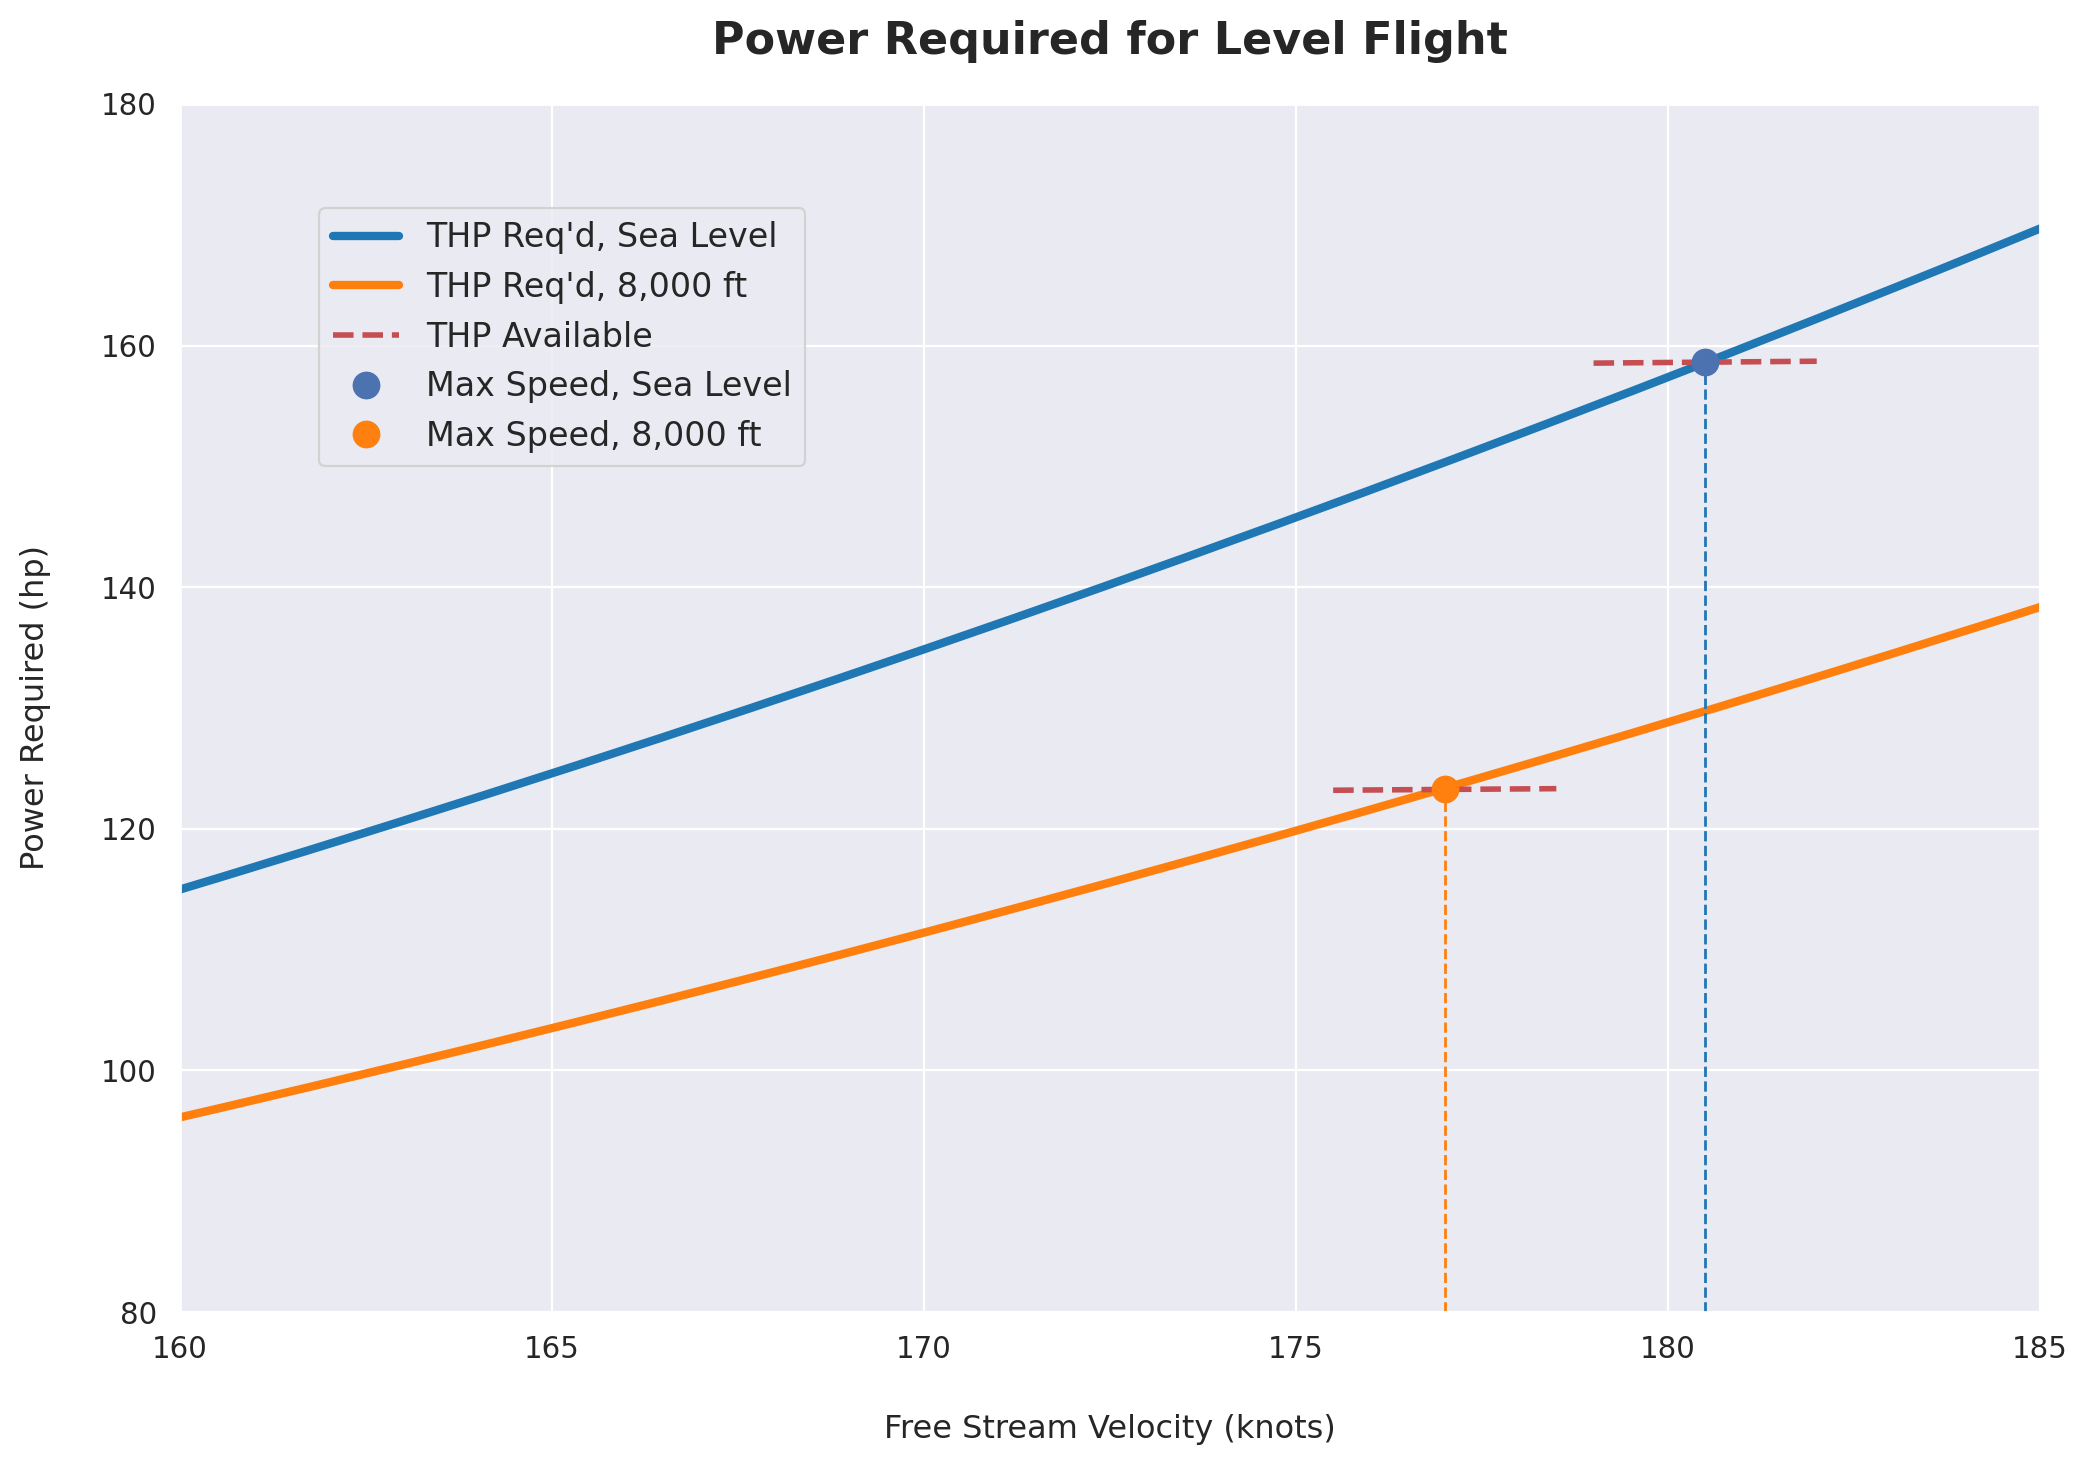
Power Available and Maximum Velocity
def plot_max_speed(V, altitude, V_range, BHPa, prop_eta):
    """
    Plot

    Keyword arguments:
    V --
    """
    # Set figure size
    fig = plt.figure(figsize=(12,8))

    # Atmosphere() needs SI units
    # (for Sea Level plot)
    alt_SI = 0

    # Create an Atmosphere object
    atm = Atmosphere(alt_SI)

    # Air density (kg/m^3)
    # (returns a np.array)
    rho = atm.density

    # Air density (slugs/ft^3)
    rho = rho[0] * 0.00194032

    # Lift coefficient
    CL = W / (0.5 * rho * V**2 * S)

    # Drag coefficient
    CD = C_d_0 + CL**2 / (np.pi * e * AR)

    # Thrust required (lbs)
    Tr = W / (CL / CD)

    # Power required (hp)
    Pr = (Tr * V) / 550

    # Thrust horsepower available
    THPa = BHPa * prop_eta

    # Add a curve (1 ft/s = 0.592484 knots)
    plt.plot(V * 0.592484, Pr, label='THP Req\'d, Sea Level')

    # Atmosphere() needs SI units
    alt_SI = altitude * 0.3048

    # Create an Atmosphere object
    atm = Atmosphere(alt_SI)

    # Air density (kg/m^3)
    # (returns a np.array)
    rho = atm.density

    # Air density (slugs/ft^3)
    rho = rho[0] * 0.00194032

    # Lift coefficient
    CL = W / (0.5 * rho * V**2 * S)

    # Drag coefficient
    CD = C_d_0 + CL**2 / (np.pi * e * AR)

    # Thrust required (lbs)
    Tr = W / (CL / CD)

    # Power required (hp)
    Pr = (Tr * V) / 550

    # Thrust horsepower available
    THPa_0 = io360_bhp[0] * eta_0
    THPa_8 = io360_bhp[8000] * eta_8

    # Add a curve (1 ft/s = 0.592484 knots)
    plt.plot(V * 0.592484, Pr, label='THP Req\'d, 8,000 ft')
    plt.plot(V_range_0, THPa_0, '--', lw=2, color="#c44e52", label='THP Available')
    plt.plot(V_range_8, THPa_8, '--', lw=2, color="#c44e52")

    # Locate the axis labels and limits
    ax = plt.gca()
    ax.set_xlim([160,185])
    ax.set_ylim([80,180])

    # Plot max speed points
    plt.plot(180.5, THPa_0[2], 'o', ms=9,
                color='#4c72b0', zorder=30, label='Max Speed, Sea Level')
    plt.plot(177, THPa_8[2], 'o', ms=9,
                color='#ff800f', zorder=30, label='Max Speed, 8,000 ft')

    ax.axvline(x=180.5, ymin=0, ymax=0.79, ls='--', lw=1)
    ax.axvline(x=177, ymin=0, ymax=0.44, ls='--', lw=1, color='#ff800f')

    # Add title and axis labels
    ax.legend(loc=(0.075, 0.70), fontsize=12)
    plt.title("Power Required for Level Flight", fontsize=16, pad=18, fontweight='bold')
    plt.ylabel('Power Required (hp)', labelpad=18)
    plt.xlabel('Free Stream Velocity (knots)', labelpad=18)
    plt.show()

    # Save the figure as PNG
    fig.savefig("charts/power-required.png", dpi=200)

# Velocity range to cross power req'd curve
V_range_0 = np.arange(179,183)
V_range_8 = np.arange(175.5,179)

# Propeller efficiency at Sea Level
eta_0 = prop_eta(D, 0.9, io360_bhp[0], V_range_0, 0)

# Propeller efficiency, 8,000 ft
eta_8 = prop_eta(D, 0.9, io360_bhp[8000], V_range_8, 8000)

# Plot max speed
plot_max_speed(V, 8000, V_range_8, io360_bhp[8000], eta_8)
References
- R. D. Kimberlin, Flight Testing of Fixed-Wing Aircraft. Reston, Va.: AIAA, 2003.
- D. P. Raymer, Aircraft Design: A Conceptual Approach. Reston, Va: AIAA, 4th ed., 2006.
- J. D. Anderson, Introduction to Flight. New York: McGraw-Hill, 5th ed., 2005.
- J. D. Mattingly and K. M. Boyer, Elements of Propulsion: Gas Turbines and Rockets. Reston, Va.: AIAA, 2nd ed., 2016.
- M. Nita and D. Scholz, “Estimating the Oswald Factor from Basic Aircraft Geometrical Parameters,” in German Aerospace Congress, pp. 1–19, Dec. 2012.
- C. E. Jobe, “Prediction of Aerodynamic Drag,” Tech. Rep. AFWAL-TM-84-203, Air Force Wright Aeronautical Laboratories, July 1984.
- C. M. Jackson Jr., “Estimation of Flight Performance with Closed-Form Approximations to the Equations of Motion,” pp. 1–33, Mar. 2001.
- I. H. Abbot, A. E. Von Doenhoff, and L. S. Stivers Jr., Summary of Airfoil Data. NACA: National Advisory Committee for Aeronautics, 1945.
- U. P. Solies, “Numerical method for estimation of propeller efficiencies,” Journal of Aircraft, vol. 31, pp. 996–998, July 1994.
Author’s Note
This article was originally published on X-Flight.info.
 Brian D. Wendt
 3D Statics Problem